


Top 10 Power BI Projects for Beginners to Build a Job-Ready Portfolio
Learning Power BI is not just about watching tutorials or memorizing DAX formulas. If you want a job as a Power BI Developer, Data Analyst, or Business Intelligence Analyst, you need practical evidence of what you can actually build.
That is why Top 10 Power BI Projects for Beginners to Build a Job-Ready Portfolio is an important starting point for anyone preparing for a data career in 2026.
Microsoft describes Power BI as a business analytics platform designed to turn data into actionable insights. Its capabilities include connecting data, modeling it, creating interactive reports, and sharing insights.
Direct Answer: Which Power BI Projects Should Beginners Build?
The best Power BI projects for beginners should demonstrate more than attractive charts. Your portfolio should show that you can clean data, create relationships, write DAX measures, design dashboards, identify business insights, and explain your recommendations.
Here are 10 strong project ideas:
| # | Project | Skills Demonstrated |
| 1 | Sales Dashboard | KPIs, DAX, slicers |
| 2 | HR Analytics Dashboard | Employee analysis |
| 3 | E-commerce Dashboard | Sales & customer insights |
| 4 | Financial Dashboard | Revenue & profit analysis |
| 5 | Marketing Campaign Dashboard | ROI & campaign performance |
| 6 | Customer Churn Dashboard | Retention analysis |
| 7 | Retail Store Dashboard | Product & regional analysis |
| 8 | Supply Chain Dashboard | Inventory & delivery |
| 9 | Hospital Analytics Dashboard | Healthcare KPIs |
| 10 | Job Market Dashboard | Skills & salary trends |
The goal is to build 3–5 excellent projects, rather than uploading 10 basic dashboards with little explanation.
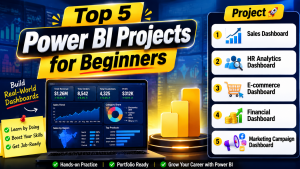
1. Sales Performance Dashboard
A Sales Dashboard is one of the best beginner Power BI portfolio projects because it covers many fundamental BI concepts.
What to include:
- Total sales
- Total profit
- Number of orders
- Monthly sales trends
- Top products
- Regional performance
- Salesperson performance
Add slicers for date, region, category, and salesperson. Create DAX measures such as Total Sales, Profit Margin, and Year-over-Year Growth.
Portfolio tip: Don’t stop at visualization. Explain why sales increased or decreased and what management should do next.
2. HR Analytics Dashboard
Build a dashboard that helps an HR team understand its workforce.
Analyze:
- Employee count
- Attrition rate
- Department-wise employees
- Average salary
- Age distribution
- Job roles
- Hiring trends
This project demonstrates your ability to convert employee data into actionable business insights.
3. E-commerce Sales Dashboard
Use an online-store dataset to analyze customer and product performance.
Track:
- Revenue
- Orders
- Average order value
- Top-selling products
- Customer segments
- Monthly growth
- Geographic performance
This is especially useful for demonstrating skills relevant to digital businesses and e-commerce companies.
4. Financial Performance Dashboard
Create a finance dashboard showing revenue, expenses, profit, and margins.
Include:
- Revenue vs. expenses
- Gross profit
- Net profit
- Profit margin
- Monthly trends
- Budget vs. actual performance
Use conditional formatting to highlight positive and negative performance.
5. Marketing Campaign Dashboard
This is an excellent project for students interested in marketing analytics.
Analyze:
- Impressions
- Clicks
- CTR
- Leads
- Conversion rate
- Cost per lead
- Campaign ROI
You can combine data from multiple campaigns and compare platforms such as Google, Meta, LinkedIn, and email marketing.
The project becomes much stronger if you finish with recommendations such as which campaign generated the highest ROI and where marketing spend should be increased.
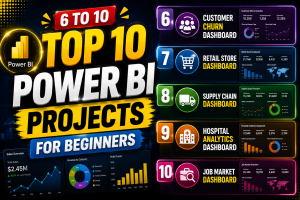
6. Customer Churn Analysis Dashboard
Customer retention is a major business problem, making churn analysis a valuable portfolio project.
Analyze:
- Total customers
- Churn rate
- Churn by customer segment
- Churn by location
- Customer tenure
- Revenue lost from churn
Use DAX and interactive filters to allow users to investigate which customer groups have the highest churn risk.
7. Retail Store Performance Dashboard
Create a dashboard for a fictional retail chain.
Measure:
- Store sales
- Product categories
- Regional performance
- Inventory
- Discounts
- Profit margins
Use maps, bar charts, cards, and trend charts carefully. Microsoft recommends using visuals to transform modeled data and calculations into meaningful insights, rather than treating visualizations as decoration. (Microsoft Learn)
8. Supply Chain Analytics Dashboard
This project can help differentiate your portfolio from typical sales dashboards.
Track:
- Inventory levels
- Delivery time
- Order quantity
- Supplier performance
- Delayed shipments
- Product availability
Add KPIs for average delivery time and delayed-order percentage.
A strong project should answer practical questions such as: Which suppliers cause the most delays? Which products are frequently out of stock?
9. Hospital Analytics Dashboard
Build a healthcare dashboard using a public or fictional dataset.
Possible metrics include:
- Patient count
- Department performance
- Admission trends
- Average stay
- Patient demographics
- Appointment statistics
Avoid using real personally identifiable patient information. Use properly anonymized or public datasets.
10. Job Market Analytics Dashboard
This is one of the most relevant Power BI projects for beginners in 2026.
Analyze job-posting data to identify:
- Most demanded skills
- Job titles
- Locations
- Salary ranges
- Experience requirements
- Industry demand
You could compare demand for Power BI, SQL, Excel, Python, cloud, and other analytics skills.
This project also gives you an excellent opportunity to demonstrate storytelling because the dashboard can answer: “What skills should an aspiring data analyst learn?”
What Should a Job-Ready Power BI Portfolio Include?
Simply creating dashboards is not enough.
For every project, include:
- Business problem – What question are you solving?
- Dataset – Where did the data come from?
- Data cleaning – What problems did you fix?
- Data model – What tables and relationships did you create?
- DAX – Which important measures did you write?
- Dashboard – What does the final report show?
- Insights – What did you discover?
- Recommendations – What should the business do?
Power BI supports interactive reports with filtering, drill-through, bookmarks, and other features, so use those capabilities when they genuinely improve the analysis. (Microsoft Learn)
A Simple Portfolio Structure
For each project, create a GitHub or portfolio page containing:
Project Title → Business Problem → Dataset → Tools → Data Cleaning → Data Model → Dashboard Screenshots → Key Insights → Business Recommendations
This makes your work easier for recruiters to understand.
How Many Projects Do You Need to Get a Job?
You don’t need 20 dashboards.
A better target is 3–5 polished Power BI portfolio projects covering different business areas.
For example:
- Sales Dashboard
- HR Analytics
- Marketing Analytics
- Customer Churn
- Job Market Analytics
This combination demonstrates versatility while keeping the portfolio manageable.
Power BI continues to have a large enterprise footprint. Microsoft reported in late 2025 that Power BI was being used by more than 375,000 organizations worldwide, with around 30 million monthly active users. (Power BI)
That makes practical Power BI skills valuable—but remember: knowing the software is different from being able to solve business problems with it.
Want to Learn Power BI Step by Step?
If you’re starting from zero, building projects without understanding the fundamentals can become frustrating. You should first learn Power Query, data modeling, DAX, visualization, dashboard design, and Power BI Service, then apply those skills through projects.
For learners looking for structured training, Innozant Institute offers Power BI training focused on practical data analytics skills and project-based learning. You can explore its course options at Innozant Institute – Power BI & Data Analytics Courses.
The important thing is not simply completing a course. Use the knowledge to build projects you can confidently explain in an interview.
Final Thoughts
The Top 10 Power BI Projects for Beginners to Build a Job-Ready Portfolio should be treated as a roadmap, not a checklist.
Start with a Sales Dashboard, then move into HR, marketing, finance, customer churn, supply chain, and job-market analytics. With every project, increase the difficulty by using better data models, stronger DAX, more advanced Power Query transformations, and clearer business storytelling.
Your portfolio should ultimately answer one question for a recruiter:
“Can this candidate use data to solve a real business problem?”
If your projects demonstrate that clearly, your Power BI portfolio becomes much more than a collection of dashboards—it becomes evidence of your analytical ability.
FAQs Of Power BI projects for beginners
1. What are the best Power BI projects for beginners?
Sales dashboards, HR analytics, e-commerce analysis, financial dashboards, and marketing campaign analysis are excellent starting points because they teach fundamental Power BI skills.
2. How many Power BI projects should I put in my portfolio?
Aim for 3–5 high-quality projects. Quality, business relevance, documentation, and your ability to explain the project matter more than quantity.
3. What skills should a Power BI project demonstrate?
A strong project can demonstrate data cleaning with Power Query, data modeling, DAX, visualization, KPI development, interactive filtering, dashboard design, and business storytelling.
4. Can Power BI projects help me get a data analyst job?
Yes, practical projects can strengthen your portfolio and give you evidence to discuss during interviews. However, projects alone don’t guarantee employment. You should also develop SQL, Excel, analytical thinking, communication, and interview skills.
5. Where can I find datasets for Power BI projects?
You can use public datasets from sources such as Microsoft Power BI samples, Kaggle, government open-data portals, and other reputable open-data platforms. Microsoft also provides sample datasets and end-to-end Power BI scenarios through its documentation.